Fuyo Lease Group is committed to the mitigation of climate change by reducing the GHG emissions of its business operations. At the same time, the Group’s business activities are based on the consideration of the risks and opportunities that climate change brings to the Group’s business environment. Aware of the importance of correctly communicating to our stakeholders the impact of climate change on us, we expressed support for the recommendations of the Task Force on Climate-Related Financial Disclosures (TCFD*1) in May 2019.
*1Task Force on Climate-Related Financial Disclosures (TCFD)
Established in December 2015 by the Financial Stability Board at the behest of the G20 Finance Ministers and Central Bank Governors Meeting.
In June 2017, it released recommendations outlining a framework for disclosing information on the finance-related risks and opportunities created by climate change.

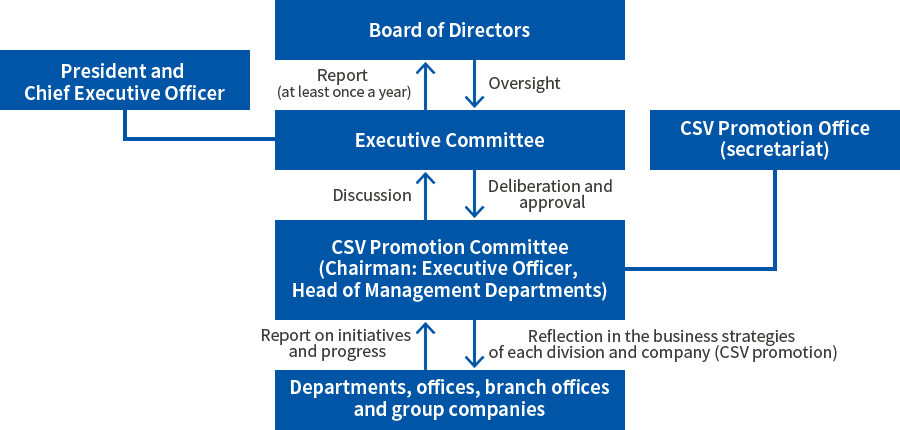
Governance
Fuyo General Lease Group has formulated the Basic Policy on Systems to Support Sustainable Value Creation as our fundamental thoughts on climate change problems and set up the CSV Promotion Committee to move ahead on efforts in this area. The committee is chaired by the executive officer who is head of management departments, and has members made up of the heads of major departments in the corporate division and heads of departments responsible for each business domain. The committee formulates, promotes, and monitors strategies, indicators, and targets related to important issues concerning climate change. The content of discussions and reports of the committee are submitted to the Executive Committee for deliberation, and the reported at least once a year to the Board of Directors.
Related Page
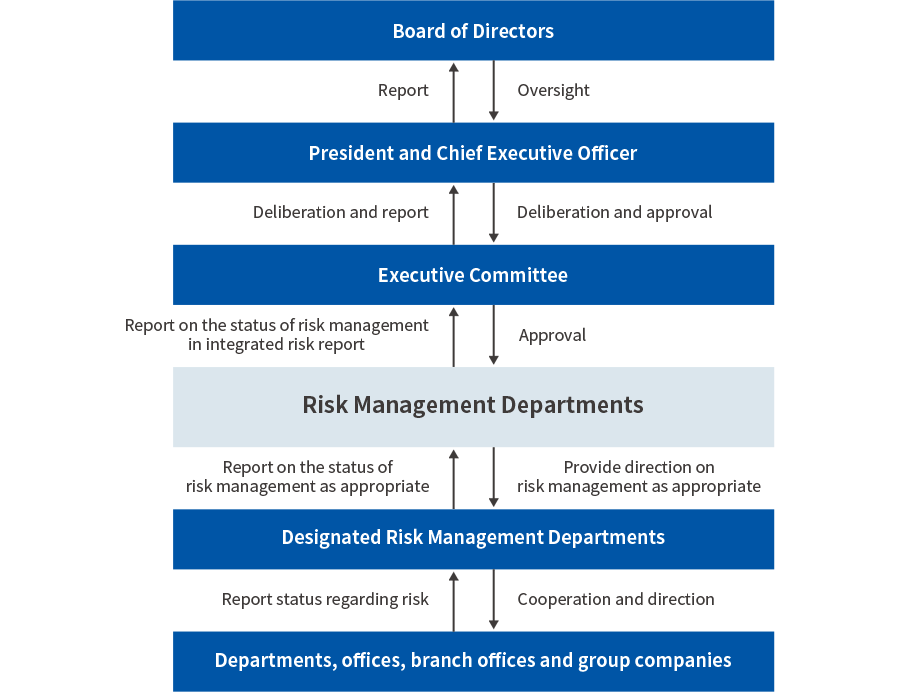
Risk Management
We believe that climate change risks are a category of managerial risks that should be managed, and we are managing these risks using an integrated risk management system. More specifically, the Corporate Planning Division is the risk management department that directs the Creating Shared Value Promotion Office, which is the department in charge of risks, regarding risk management whenever appropriate. The Creating Shared Value Promotion Office monitors major risks related to climate change that may affect the Fuyo Lease Group and reports any risks that have occurred immediately to the risk management department, receives guidance, and takes appropriate action.
Strategy
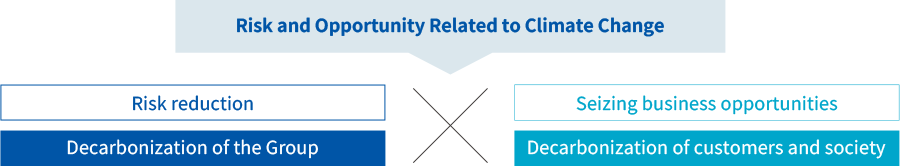
As countries work to reduce greenhouse gases amid worsening climate change, business environments are rapidly transforming toward decarbonization through society as a whole. The Fuyo Lease Group identified risks and opportunities through a scenario analysis and is moving forward on a dual wheel decarbonization strategy of decarbonization of the Group as a form of risk reduction and decarbonization of customers and society as a business opportunity.
See Climate Change Response details on the Fuyo Lease Group’s decarbonization strategy and initiatives.
Climate-Related Scenario Analysis
The Group uses scenario analysis methods to forecast and analyze changes in the external environment as of 2030 in accordance with the framework proposed by the TCFD*1 to understand the risks and opportunities and financial impact of climate change on business activities in the future. To ensure that the analysis is based on a variety of climate change-related scenarios, the Group conducted its assessment based on two climate change scenarios: the 1.5°C scenario, which is sufficiently lower than the 2°C target of the Paris Agreement, and the 4°C scenario.
Change in global average temperatures
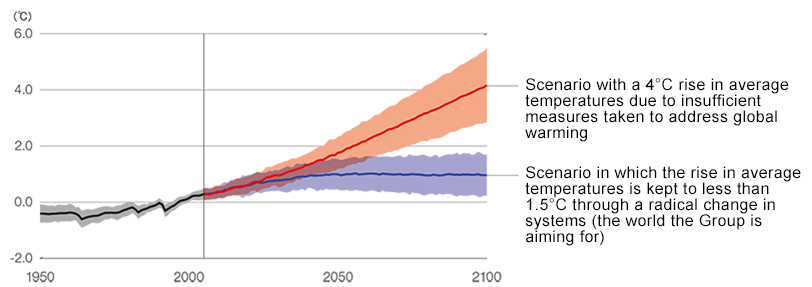
Source: Created by Fuyo Lease based on IPCC Fifth Assessment Report WG1
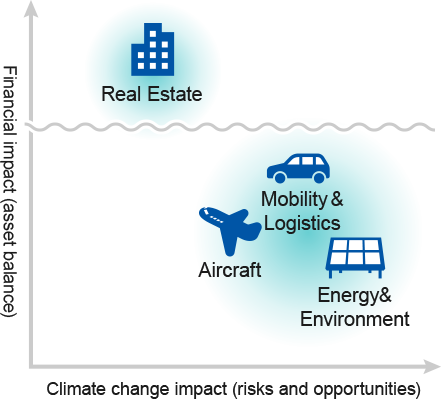
As the scope of our business activities is broad and varied, we started our analysis by identifying impact over the entire Group, and then carried out scenario analysis focused on the Real Estate domain, which is large in terms of assets, and on three domains containing businesses whose characteristics mean they are particularly susceptible to the impact of climate change (Energy & Environment, Mobility & Logistics, and Aircraft).
Correlation Between the Severity of the Impact of Climate Change and the Group’s Businesses
Climate Change Risks and Opportunities
Climate Change Risks*2
In regard to impact over the entire Group, we identified an increase in costs for the achievement of RE100 and carbon neutrality due to the introduction of a carbon tax as a risk. However, as a result of calculating the monetary amount of this impact based on the Group’s CO₂ emissions, we recognize that the financial impact of this risk is minor.
Additionally, the risks in each domain identified as being particularly susceptible to the impact of climate change are as follows.
| Domain | Category | Effect on Our Operations | ||||
|---|---|---|---|---|---|---|
| Business Summary | Timeframe | Impact by Scenario | ||||
| 1.5°C | 4°C | |||||
| Group-wide | Transition risks | Introduction of a carbon tax (policies and legal regulations) | Risk of an increase in costs for the achievement of RE100 and carbon neutrality due to the introduction of a carbon tax | Medium-to long-term | Minor | Minor |
| Real Estate | Transition risks | Decline in competitiveness due to changes in customer preferences (markets) | Risk of a decline in profitability and credibility as a debtor if properties that have been invested in through real estate financing transactions, etc., are slow to adapt to environmental measures | Medium-to long-term | Medium | Minor |
| Physical risks | Increasingly serious natural disasters (acute) | Risk of rises in insurance premiums due to the increasing frequency and intensification of natural disasters | Short-to long-term | Minor | Minor | |
| Energy & Environment | Transition risks | Institutional changes to energy purchase systems (FIT, FIP), etc. (policy and legal restrictions) | Risk of decreases in revenue from electric power sales, increases in operational costs, etc. in the event of unexpected institutional changes | Short-to long-term | Medium | Medium |
| Changes in the business environment around the renewable energy generation business (markets) | Risk of decreases in revenue from electric power sales due to restrictions on output | Medium-to long-term | Medium | Medium | ||
| Physical risks | Increasingly serious natural disasters (acute) | Risk of rises in insurance premiums due to the increasing frequency and intensification of natural disasters | Short-to long-term | Medium | Medium | |
| Mobility | Transition risks | Stricter regulation of CO₂ emissions (policy and legal restrictions) | Risk of a decrease in demand for the lease of conventional diesel- and gasoline-powered vehicles due to a decrease in demand for gasoline-powered vehicles following the tightening of CO₂ emissions regulations, etc. | Medium-to long-term | Medium | Minor to medium |
| Changes in the business environment (markets) | Risk of a decrease in the resale prices of gasoline vehicles in accordance with a shift to EV | Medium-to long-term | Medium | Minor | ||
| Decrease in maintenance revenues (technology) | Risk of a decrease in sales and revenues related to maintenance in accordance with a shift to EV | Long-term | Medium | Minor | ||
| Aircraft | Transition risks | Decline in aircraft demand due to stricter regulations (policy and legal restrictions) | Risk of a decrease in lease revenues due to a decline in demand for aircraft following the tightening of CO₂ emissions regulations, etc. | Medium-to long-term | Minor | Minor |
| Changes in the business environment (markets) | Risk of a decrease in profits resulting from a fall in the resale prices of old model aircraft after the termination of the lease period in accordance with the shift to fuel-efficient aircraft | Medium-to long-term | Medium | Minor | ||
- Definitions of time frames
-
Short-term: Present-2025; medium-term: 2026-2030; long-term: 2031-2050
- Definitions of impact (monetary impact on our consolidated gross profit in 2030)
-
Major: Greater than 3 billion yen; medium: 100 million-3 billion yen; minor: Smaller than 100 million yen
-
*2In analyzing the 1.5°C scenario, there were some items where external information was insufficient, so data from the 2°C scenario was used.
Climate Change Opportunities*3
We have positioned the creation of social value through solutions to climate change issues as an important business opportunity and in our Medium-Term Management Plan Fuyo Shared Value 2026, we have formulated strategies that incorporate the global aim of keeping temperature rises under 1.5°C. Within this, we are disclosing the items that the Group is being particularly active in engaging as opportunities.
|
Domain |
Category |
Effect on Our Operations |
||||
|---|---|---|---|---|---|---|
|
Business Summary |
Timeframe |
Impact by Scenario |
||||
| 1.5°C | 4°C | |||||
|
Energy & Environment |
Opportunities |
Rise in demand for renewable energy (products, services, and markets) |
Increase of initiatives for renewable energy projects in Japan |
Short-to long-term |
Major |
Major |
|
Increase of initiatives for renewable energy projects overseas |
Short-to long-term |
Major |
Medium |
|||
|
Business opportunities created by new technologies, new systems, etc. (products, services, and markets) |
Increase of initiatives for new areas of business such as secondary energy |
Short-to long-term |
Major |
Medium |
||
|
Mobility |
Opportunities |
Rise in demand for electric vehicles (markets) |
|
Short-to long-term |
Medium |
Medium |
|
Rise in demand for services related to electric vehicles (products and services) |
||||||
|
Aircraft |
Opportunities |
Introduction of new technologies related to aircraft and the formation of new markets (products and services) |
|
Medium-to long-term |
Medium |
Medium |
- Definitions of time frames
-
Short-term: Present-2025; medium-term: 2026-2030; long-term: 2031-2050
- Definitions of impact (monetary impact on our consolidated gross profit in 2030)
-
Major: Greater than 3 billion yen; medium: 100 million-3 billion yen; minor: Smaller than 100 million yen
-
*3In analyzing the 1.5°C scenario, there were some items where external information was insufficient, so data from the 2°C scenario was used.
About the Impact on the Group’s Business
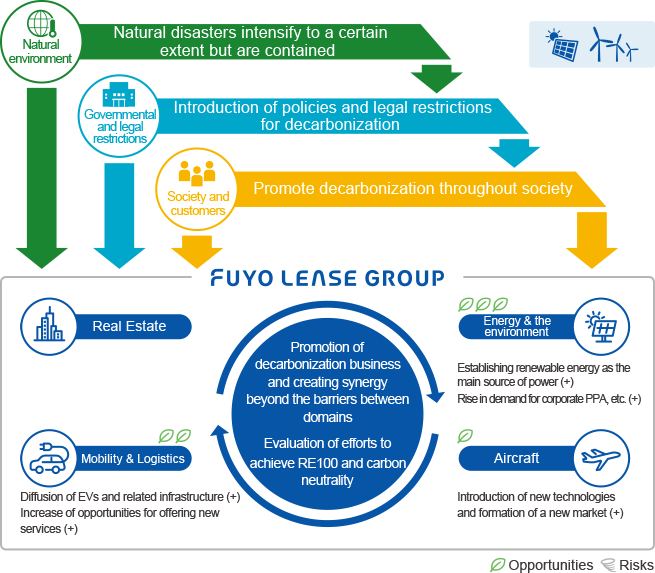
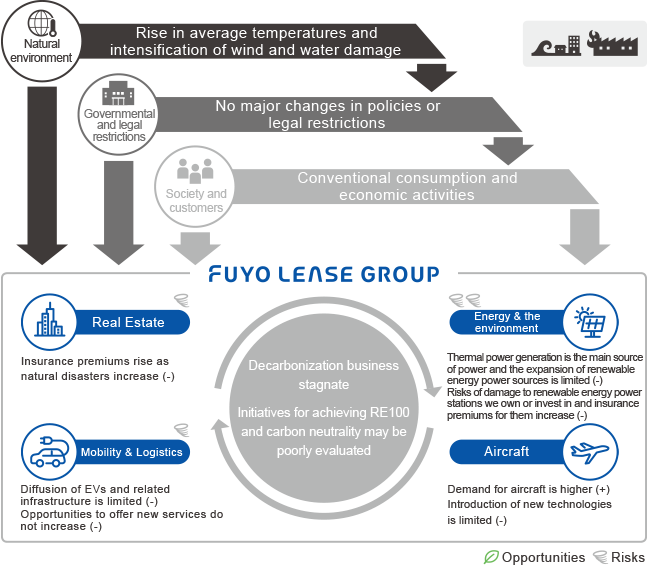
Our analysis shows that for both the 1.5°C and 4°C scenarios, the impact of climate change risks on the Group’s business will be limited, while the opportunities will be great. It also revealed that although both scenarios are expected to result in an increase in consolidated gross profit, there is more potential for an increase in profit in the 1.5°C scenario.
Perspective under 1.5°C scenario
Perspective under 4°C scenario
Indicators and Targets
The Group recognizes that climate change-related risks and opportunities will have a significant impact on the Group’s business activities and is proactively responding from both aspects of promoting decarbonization of the Group and decarbonization of customers and society through business.
From the perspective of the Group’s promotion of decarbonization, in 2018 we became the first general lease company in Japan to participate in RE100, starting initiatives to convert to renewable energies for electricity consumption and in 2021 declared an intention to achieve carbon neutrality by 2030.
Moreover, as a Group with a wide-ranging business domain and customer base, we made achievement of decarbonization a Materiality KPI as we believe contribution to decarbonization of customers and society through business is an important issue, and set contribution to CO₂ reduction as a non-financial target to be achieved through the installation and replacement of renewable energy and energy-saving equipment and devices for its customers. We will promote decarbonization of customers and society in such ways as expanding use of renewable energies in the power generation business and strengthening financing of EV and FCV, while at the same time capture profits.
We have determined indicators and targets for both decarbonization of the Group to reduce risk and decarbonization of customers and society as a business opportunity.
Indicators and targets for risks: Decarbonization of the Group
|
FY2030 Targets |
FY2024 Targets |
FY2023 Results |
||
|---|---|---|---|---|
|
RE100 target*4 (Percentage of energy used that is renewable energy) |
100% |
50% |
85% |
|
|
CO₂ emissions*4 (Scope 1 and 2) |
Achievement of carbon neutrality |
Compared to FY2020 30% reduction |
Compared to FY2020 55% reduction |
Emissions 899t-CO₂ |
-
*4The scope includes Fuyo General Lease and its consolidated subsidiaries.
Indicators and targets for opportunities: Decarbonization of customers and society
Non-financial goals (excerpt of climate change-related targets)
|
FY2026 Targets |
FY2022 Results |
|
|---|---|---|
|
CO₂ reduction contributions |
500,000 t-CO₂ / year |
220,000 t-CO₂ / year |
|
Amount invested in promoting decarbonization*5 |
¥300.0 billion |
¥56.4 billion |
|
Renewable energy generation capacity*6 |
1,000MW |
515MW |
|
Percentage of Group vehicles that are EVs or FCVs*7 |
30% |
0.7% |
|
Amount of financing handled for the promotion of decarbonization*8 |
¥12.0 billion |
¥5.3 billion |
-
*5Applies to investments in renewable energy facilities, energy-saving facilities, electric vehicles (including charging equipment), batteries, hydrogen and ammoniarelated facilities, CO2 separation and recovery technologies (CCUS, DAC), circular-related facilities, ZEB/Green buildings, SAF and start-up companies.
-
*6Applies to investments and project financing, etc., made in the Renewable Energy Generation Business (power generation capacity is calculated based on ownership ratio or share).
-
*7Percentage held by Fuyo Auto Lease.
-
*8Covers the Fuyo 100% Renewable Electricity Declaration Support Program, the Fuyo Zero Carbon City Support Program and the Fuyo Circular Economy Lease.
Reference: Environmental Data
The Group’s CO₂ emissions volumes and other important environmental data for the past 10 years are as follows.
|
2013 |
2014 |
2015 |
2016 |
2017 |
2018 |
2019 |
2020 |
2021 |
2022 |
2023 |
||
|---|---|---|---|---|---|---|---|---|---|---|---|---|
|
CO₂ emissions (t-CO₂)*9 *10 |
Scope1 |
192 |
159 |
153 |
163 |
770 |
707 |
688 |
603 |
584 |
558 |
532 |
|
Scope2 |
956 |
1,110 |
1,045 |
1,089 |
1,273 |
1,197 |
1,283 |
1,414 |
872 |
1,157 |
367 |
|
|
Scope1+2 |
1,148 |
1,269 |
1,199 |
1,253 |
2,043 |
1,904 |
1,971 |
2,016 |
1,455 |
1,715 |
899 |
|
|
Scope3*11 |
1,246,345 |
1,243,298 |
1,420,896 |
1,639,334 |
1,768,197 |
2,789,556 |
2,866,387 |
2,372,283 |
2,471,642 |
2,149,492 |
2,632,821 |
|
|
CO₂ emission intensity (Scope1, 2) (t-CO₂ / 100 millions of yen) |
0.31 |
0.33 |
0.30 |
0.32 |
0.36 |
0.36 |
0.29 |
0.28 |
0.22 |
0.25 |
0.13 |
|
|
Renewable energy power generation capacity (MW)*12 |
23 |
48 |
77 |
86 |
111 |
149 |
229 |
283 |
318 |
515 |
705 |
|
|
CO₂ emissions reduction contribution due to renewable energy power generation (t-CO₂) |
8,910 |
22,236 |
39,636 |
54,115 |
48,258 |
69,514 |
85,577 |
147,574 |
153,442 |
210,782 |
323,648 |
|
|
CO₂ emissions reduction contribution due to other business (t-CO₂) |
- |
- |
- |
- |
- |
- |
- |
- |
- |
9,373 |
12,767 |
|
-
*9Electricity usage has been estimated for some locations. The estimation method is based on multiplying the area of the site subject to estimation by the electricity consumption per area of the Fuyo Lease head office, the entire building of the site subject to estimation, or the head office of the site subject to estimation.
-
*10Adjusted CO₂ emissions volumes are calculated using the emission coefficient specified in the Ministerial Ordinance on Calculation of Greenhouse Gas Emissions Emitted by Specified Emitters. (Calculations concerning domestic electric power use the annual adjusted emission coefficients for general power transmission and distribution businesses that supply power in the regions where the offices to which the calculations apply operate. Calculations concerning overseas electric power use the emission coefficients of the specific country published by the International Energy Agency [IEA]). The statistics are collected from Fuyo General Lease Co., Ltd. and all consolidated subsidiaries. For overseas affiliates and subsidiaries and Group companies, figures from before figures began to be recorded are not included.
-
*11Scope 3 emissions are calculated based on Basic Guidelines on Accounting for Greenhouse Gas Emissions Throughout the Supply Chain (Ministry of the Environment and Ministry of Economy, Trade and Industry Government of Japan).
Up to fiscal 2017, the data was calculated using emissions unit values from the Database for Emissions Unit Values for Accounting of Greenhouse Gas Emissions, etc., by Organizations throughout the Supply Chain (Ver. 2.6). From fiscal 2018, the data was calculated using emissions unit values from the Database for Emissions Unit Values for Accounting of Greenhouse Gas Emissions, etc., by Organizations throughout the Supply Chain (Ver. 3.0) and LCI Database IDEAv2 (For Calculating Greenhouse Gas Emissions in the Supply Chain).
From fiscal 2021, the data was calculated using emissions unit values from the Database for Emissions Unit Values for Accounting of Greenhouse Gas Emissions, etc., by Organizations throughout the Supply Chain (Ver. 3.2) and LCI Database IDEAv2 (For Calculating Greenhouse Gas Emissions in the Supply Chain).
From fiscal 2022, the data was calculated using emissions unit values from the Database for Emissions Unit Values for Accounting of Greenhouse Gas Emissions, etc., by Organizations throughout the Supply Chain (Ver. 3.3) and LCI Database IDEAv2 (For Calculating Greenhouse Gas Emissions in the Supply Chain).
The statistics are collected from the Fuyo Lease Group and calculations cover all 15 categories. -
*12Covers investments made in the Renewable Energy Generation Business, project financing, etc. (power generation capacity is calculated based on ownership ratio or share). From fiscal 2021, figures have been adjusted to include projects still in development.