|
Scope of coverage |
Listed by indicators
|
|---|---|
|
Calculation period |
One year from April 1 to March 31 of the following year |
|
Independent Assurance |
Environmental and social performance data indicated by the checkmark, ☑, have limited assurance by Ernst & Young ShinNihon LLC. |
- Environmental Data
1. Environmental Data
1-1 Energy / CO₂
Scope of coverage: Consolidated data
|
Indicator |
Calculation applicability |
Calculation method |
|---|---|---|
|
Total Energy Consumption |
Electricity, city gas, LP gas, gasoline, diesel |
Total amount of various fuels used (*1) or purchased amount. |
|
Electricity Consumption |
Conventional electricity, renewable energies |
Total amount of each type of electricity used (*1). |
|
Total Gasoline and Diesel Consumed by Company Vehicles |
Gasoline, diesel |
Total amount of each type of fuels used or purchased. |
|
Total CO₂ Emissions |
Scope 1: Direct emissions from the use of fuel for company vehicles, city gas, natural gas. |
Calculated by multiplying the amount of each type of fuel used (*1) or purchased by the CO₂ emission factor for each energy source. |
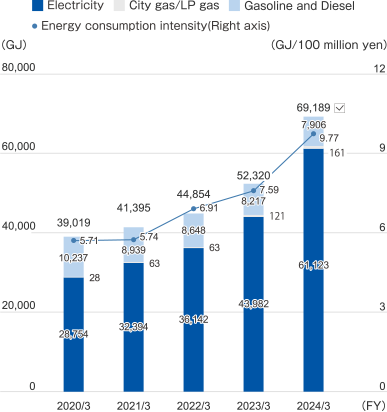
Total Energy Consumption*1
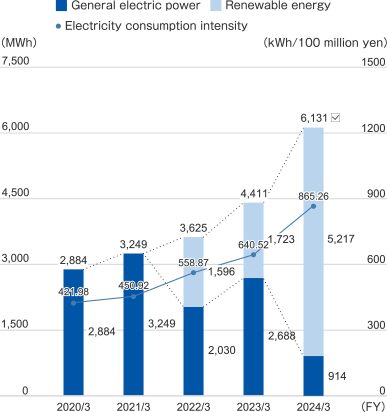
Electricity Consumption*1
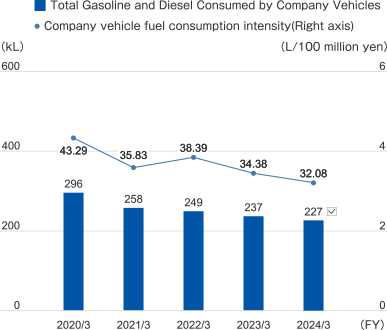
Total Gasoline and Diesel Consumed by Company Vehicles*2
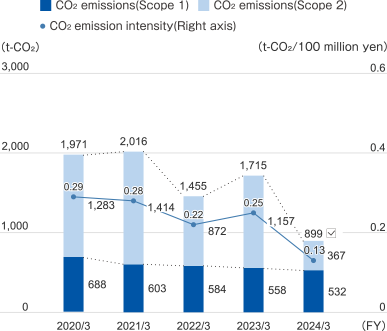
Total CO₂ Emissions (Scope 1, 2)*1 *3
CO₂ emissions (Scope 1, 2, 3)*1*3*4
| CO₂ emissions (t-CO₂) | Ratio of total CO₂ emissions (2024/3) | |||||
|---|---|---|---|---|---|---|
| 2020/3 | 2021/3 | 2022/3 | 2023/3 | 2024/3 | ||
| Scope 1 | 687 | 603 | 584 | 558 | 532☑ | 0.02% |
| Scope 2 | 1,318 | 1,460 | 872 | 1,157 | 367☑ | 0.01% |
| Scope 3 | 2,866,387 | 2,372,283 | 2,471,642 | 2,149,492 | 2,632,822☑ | 99.96% |
| Total CO₂ emissions | 2,868,394 | 2,374,345 | 2,473,098 | 2,151,207 | 2,633,721 | 100% |
CO₂ emissions (Components of Scope 3)*4
| Category | CO₂ emissions (t-CO₂) | Composition ratios in total CO₂ emissions (2024/3) | Calculation method / remarks | ||||
|---|---|---|---|---|---|---|---|
| 2020/3 | 2021/3 | 2022/3 | 2023/3 | 2024/3 | |||
| 1. Purchased products and services | 2,166,659 | 1,837,264 | 1,939,951 | 1,846,951 | 2,406,846 | 91.417% | Calculated by multiplying the actual amount by segment based on the contract execution results of leasing and installment sales for the current fiscal year in consolidated accounting by the emission intensity based on the Input-Output Tables for Japan and purchase price for the target device (*5). |
| 2. Capital products | 1,076 | 8,359 | 1,917 | 1,926 | 1,660 | 0.063% | Calculated by multiplying the acquisition amount of corporate assets purchased in the current fiscal year by the emission intensity. |
| 3. Fuel- and energy-related activities not included in Scope 1 or 2 | 362 | 366 | 385 | 433 | 544 | 0.021% | Calculated by multiplying the amount of electricity and fossil fuels used in the Scope 1 and 2 calculations by emission intensity. |
| 4. Transportation and distribution (upstream) | 436,416 | 303,049 | 330,273 | 2,350 | 895 | 0.034% | Based on the contract execution results of leasing and installment sales for the current fiscal year in consolidated accounting, and assuming the weight per amount of the representative product (*6), the transportation ton -kilometer is calculated from the transportation distance (domestic truck transportation of 1,000 km one way) based on the transportation scenario. This transportation tonne -kilometer is then multiplied by the domestic truck transportation emission intensity. |
| 5. Waste generated in operations*7 | 291 | 170 | 143 | 101 | 61 | 0.002% | Calculation is based on generation of industrial waste and general garbage until 2020/3, and generation of industrial waste and general waste from 2021/3, multiplied by emission coefficients for each type of disposal method. |
| 6. Business travel | 314 | 94* | 152* | 448 | 457 | 0.017% | Calculated by multiplying the number of consolidated employees by the emission intensity per employee. *As the impact of COVID-19 caused a significant reduction in business travel in 2021/3 and 2022/3, calculations are based on the number of consolidated employees multiplied by the emissions intensity and business travel expenses relative to fiscal 2019. |
| 7. Employee commuting | 576 | 631 | 760 | 822 | 838 | 0.032% | Calculated by multiplying the number of consolidated employees with the number of business days at Fuyo General Lease's head office, and the emission intensity per working day (Work type: Office, City classification: Large city). |
| 8. Leased assets (upstream) | Not applicable | Not applicable | Not applicable | Not applicable | Not applicable | Not applicable | Not applicable (Energy usage for rented offices, etc., is included in Scope 1 and 2.) |
| 9. Transportation and distribution (downstream) | Not applicable | Not applicable | Not applicable | Not applicable | Not applicable | Not applicable | Not applicable (There are no applicable emissions since the Company bears transportation costs in the entire logistics process.) |
| 10. Processing of sold products | Not applicable | Not applicable | Not applicable | Not applicable | Not applicable | Not applicable | Not applicable (There are no applicable emissions since the Company does not handle intermediate products.) |
| 11. Use of sold products | 254,848 | 213,255 | 193,851 | 10,736 | 9,128 | 0.347% | Based on the contract execution results of installment sales (leasing and installment sales until 2022/3) for the fiscal year under review in consolidated accounting, we made assumptions about sales volumes per unit sales amount for representative products (*6). We then estimated the energy consumption resulting from the usage of these representative products, considering factors such as regular usage scenarios. These scenarios are assumed based on product design specifications and consumers' usage conditions. Finally, the outcome is multiplied by the emission intensity for each energy type. |
| 12. End-of-life treatment of sold products | 17 | 15 | 11 | 38 | 10 | 0.000% | Based on the contract execution results of installment sales for the current fiscal year in consolidated accounting, the weight per amount of representative product (*6) is assumed, the installment sales product weight is calculated, and this weight is multiplied by the emission intensity for each waste type. |
| 13. Assets (downstream) | - | - | - | 281,189 | 206,784 | 7.854% | Based on the operating lease asset balance for the fiscal year under review in consolidated accounting, we made assumptions about number of lease units per unit sales amount for representative products (*6). We then estimated the energy consumption resulting from the usage of these representative products, considering factors such as regular usage scenarios. These scenarios are assumed based on product design specifications and consumers' usage conditions. Finally, the outcome is multiplied by the emission intensity for each energy type. |
| 14. Franchises | Not applicable | Not applicable | Not applicable | Not applicable | Not applicable | Not applicable | Not applicable (There are no applicable emissions since the Company has no franchise.) |
| 15. Investments*8 | 5,830 | 9,080 | 4,200 | 4,497 | 5,598 | 0.213% | Calculated by multiplying the Scope 1 and 2 emissions of major investees (listed share issues selected to account for 80% or more of the final balance of listed shares) in the previous fiscal year by the shareholding ratio. |
| Total CO₂ emissions | 2,866,387 | 2,372,283 | 2,471,642 | 2,149,492 | 2,632,822☑ | 100% | The Ministry of the Environment's "Basic Guidelines on Accounting for Greenhouse Gas Emissions Throughout the Supply Chain (ver.3.4)" and the "LCI database IDEAv2 (for calculating greenhouse gas emissions in supply chains)" are applied to the above emission intensity. |
-
*1Electricity usage has been estimated for some locations. The estimation method is based on multiplying the area of the site subject to estimation by the electricity consumption per area of the Fuyo Lease head office, the entire building of the site subject to estimation, or the head office of the site subject to estimation.
-
*2In addition to values shown in the graph, 257.01 kg of hydrogen fuel was used.
-
*3Total CO₂ emissions (Scope1,2) were calculated with the emission factors specified by the government based on the Ministerial Ordinance Concerning GHG emissions Associated with Business Activities of Specified Emitters (The emissions associated with electricity are calculated based on the adjusted annual emission factors issued by power transmission and distribution business operators of where our regional operations and offices are located. Calculations concerning overseas electric power use the emission coefficients of the specific country published by the International Energy Agency [IEA]). However, Fuyo General Lease and the Group's companies are not considered to be specified emitters.
-
*4The total emissions (Scope3) are calculated for all calculable categories based on "Basic Guidelines on Accounting for Greenhouse Gas Emissions Throughout the Supply Chain (Ministry of the Environment, Ministry of Economy, Trade and Industry)."
From fiscal 2018, the data was calculated using emissions unit values from the "Database for Emissions Unit Values for Calculation of Greenhouse Gas Emissions, etc., by Organizations throughout the Supply Chain (Ver. 3.0)" and "LCI Database IDEAv2 (For Calculating Greenhouse Gas Emissions in the Supply Chain)."
From fiscal 2021, the data was calculated using emissions unit values from the "Database for Emissions Unit Values for Calculation of Greenhouse Gas Emissions, etc., by Organizations throughout the Supply Chain (Ver. 3.2)" and "LCI Database IDEAv2 (For Calculating Greenhouse Gas Emissions in the Supply Chain)."
From fiscal 2022, the data was calculated using emissions unit values from the "Database for Emissions Unit Values for Calculation of Greenhouse Gas Emissions, etc., by Organizations throughout the Supply Chain (Ver. 3.3)" and "LCI Database IDEAv2 (For Calculating Greenhouse Gas Emissions in the Supply Chain)."
From fiscal 2023, the data was calculated using emissions unit values from the "Database for Emissions Unit Values for Calculation of Greenhouse Gas Emissions, etc., by Organizations throughout the Supply Chain (Ver. 3.4)" and "LCI Database IDEAv2 (For Calculating Greenhouse Gas Emissions in the Supply Chain)." -
*5Representative products for leasing are personal computers, other general industrial machinery and equipment, construction and mining equipment, aircraft, trucks, buses, and other motor vehicles, passenger cars, medical machinery and equipment, other office equipment and nonresidential construction (non-timber construction). Representative products for installment sales are service equipment and construction and mining equipment.
-
*6As a wide range of products is handled through leasing and installment sales, it is difficult to measure the usage situation of each individual product. Therefore, the statistics have been standardized using IT and office equipment (laptop computers) as the representative product.
-
*7Scope of coverage includes industrial waste from all domestic locations of Fuyo General Lease Co., Ltd. and FGL Circular Network Co., Ltd., as well as general waste from Fuyo General Lease / head office, FGL GROUP Business Service Co., Ltd., FGL GROUP Management Service Co., Ltd., FGL LeaseUp Business Service Co., Ltd. and INVOICE INC. / head office.
-
*8Scope of coverage is Fuyo General Lease Co., Ltd.
1-2 Waste
Scope of coverage: All domestic locations of Fuyo General Lease and FGL Circular Network Co., Ltd.
|
Indicator |
Calculation applicability |
Calculation method |
|---|---|---|
|
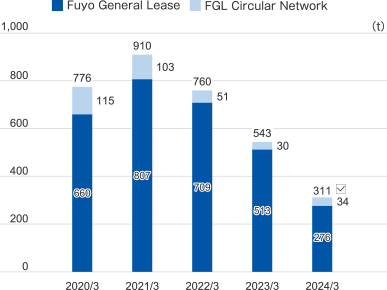
Volume of Industrial Waste Generated |
In addition to industrial waste, includes items such as bottles among objects, but not cardboard. |
Total of industrial waste items that can be confirmed weight from the manifest. |
Volume of Industrial Waste Generated
1-3 Water Consumption
Scope of coverage: Fuyo General Lease Co., Ltd. / Head Office (including FGL GROUP Management Service Co., Ltd.) and Aqua Art Co., Ltd.
Volume of water consumed*9
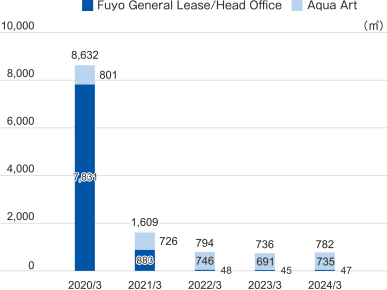
-
*9For Fuyo General Lease, only water consumption for certain floors of Fuyo General Lease / head office was applicable in calculations from June 2020 onward due to the relocation of head office, resulting in a significant decrease in water consumption from fiscal 2020.
2. Social Data
2-1 Employees
Scope of coverage: Non-consolidated data unless otherwise noted
Reference date: Final day of calculation period (March 31)
|
Indicator |
Calculation applicability |
Calculation method |
|---|---|---|
|
Retention rate of employees after 3 years |
Applies to new graduates (managerial career track and operations staff) |
Percentage of employees who joined the Company in the applicable fiscal year and remain employed as of April three years thereafter. |
|
Turnover rate |
Coverage for key career track, managerial career track and operations staff employees. |
Turnover rate = the number of employees who left their job during the fiscal year divided by the number of key career track, managerial career track and operations staff on the first day of the fiscal year (April 1), multiplied by 100. |
Number of employees – consolidated data (persons)
| End of FY 2017 | End of FY 2018 | End of FY 2019 | End of FY 2020 | End of FY 2021 | End of FY 2022 | End of FY 2023 | |
|---|---|---|---|---|---|---|---|
| Number of employees | 1,715 | 1,960 | 2,416 | 2,637 | 3,189 | 3,437 | 3,503 |
Number of employees (persons)
| End of FY 2019 | End of FY 2020 | End of FY 2021 | End of FY 2022 | End of FY 2023 | |||||||||||
|---|---|---|---|---|---|---|---|---|---|---|---|---|---|---|---|
| Male | Female | Total | Male | Female | Total | Male | Female | Total | Male | Female | Total | Male | Female | Total | |
| Key career track and managerial career track employees*10 | 456 | 85 | 541 | 469 | 104 | 573 | 473 | 122 | 595 | 468 | 139 | 607 | 451 | 164 | 615 |
| Operations staff*10 | 1 | 138 | 139 | 2 | 137 | 139 | 2 | 142 | 144 | 3 | 139 | 142 | 3 | 134 | 137 |
| Temporary employees | 28 | 7 | 35 | 38 | 9 | 47 | 46 | 13 | 59 | 54 | 13 | 67 | 59 | 19 | 78 |
| Total | 485 | 230 | 715 | 509 | 250 | 759 | 521 | 277 | 798 | 525 | 291 | 816 | 513 | 317 | 830 |
-
*10In the fiscal 2019 revision to the human resources system, the classification of managerial career track and general staff changed to key career track, managerial career track, and operations staff.
Number of new graduates employed (persons)
| FY of joining Fuyo Lease | FY 2016 | FY 2017 | FY 2018 | FY 2019 | FY 2020 | FY 2021 | FY 2022 | FY 2023 |
|---|---|---|---|---|---|---|---|---|
| Total | 28 | 31 | 35 | 29 | 45 | 38 | 43 | 44 |
| Male | 20 | 18 | 20 | 18 | 27 | 18 | 20 | 18 |
| Female | 8 | 13 | 15 | 11 | 18 | 20 | 23 | 26 |
Number of new graduates employed (persons) and retention rate after 3 years (%)
| FY of joining Fuyo Lease | FY 2015 | FY 2016 | FY 2017 | FY 2018 | FY 2019 | FY 2020 | FY 2021 |
|---|---|---|---|---|---|---|---|
| Managerial career track employees | 26 | 22 | 29 | 29 | 27 | 39 | 37 |
| Operations staff | 0 | 6 | 2 | 6 | 2 | 6 | 1 |
| Total | 26 | 28 | 31 | 35 | 29 | 45 | 38 |
| Retention rate of employees 3 years after joining Fuyo Lease | 100 | 85.7 | 100 | 94.3 | 89.7 | 88.9 | 94.7☑ |
Rate of mid-career hires (%)
| FY of joining Fuyo Lease | FY 2018 |
FY 2019 |
FY 2020 |
FY 2021 |
FY 2022 |
FY 2023 |
|---|---|---|---|---|---|---|
Rate of mid-career hires |
14.6 |
21.6 |
6.3 |
22.4 |
28.3 |
29.0 |
Number of employees leaving (persons) / reasons for leave / turnover rate (%)
| FY 2017 | FY 2018 | FY 2019 | FY 2020 | FY 2021 | FY 2022 | FY 2023 | |
|---|---|---|---|---|---|---|---|
| Key career track and managerial career track employees*10 | 11 | 13 | 10 | 12 | 15 | 18 | 25 |
| Operations staff*10 | 3 | 2 | 4 | 2 | 1 | 1 | 3 |
| Total | 14 | 15 | 14 | 14 | 16 | 19 | 28 |
| Voluntary resignation | 9 | 14 | 11 | 11 | 11 | 14 | 23 |
| Mandatory retirement | 2 | 1 | 2 | 1 | 1 | 3 | 3 |
| Other | 3 | 0 | 1 | 2 | 4 | 2 | 2 |
| Turnover rate | 1.9 | 1.9 | 1.8 | 1.7 | 1.9 | 2.2 | 3.2☑ |
Average age (age) / average length of service (years) / average salary (thousand yen)
| End of FY 2017 | End of FY 2018 | End of FY 2019 | End of FY 2020 | End of FY 2021 | End of FY 2022 | End of FY 2023 | |
|---|---|---|---|---|---|---|---|
| Average Age | 41.4 | 41.2 | 41.3 | 41.4 | 41.4 | 41.3 | 41.3 |
| Length of service | 14.7 | 14.6 | 14.8 | 14.5 | 14.2 | 14.1 | 14.1 |
| Annual salary | 8,454 | 8,669 | 8,833 | 8,675 | 8,771 | 8,734 | 8,911 |
2-2 Diversity & Inclusion
Scope of coverage: Non-consolidated data
Reference date: March 1 only for employment of employees with a disability and, for others, final day of calculation period (March 31)
|
Indicator |
Calculation applicability |
Calculation method |
|---|---|---|
|
Number of female employees in management positions (Employees) |
Applies to regular employees. Revision to the human resources system at the end of fiscal 2019 classified senior leaders (a position equivalent to the position of section chief) as managers. |
Total number of female managers. |
|
Percentage of female employees in management positions (%) |
As above. |
Ratio of women among the number of male and female managers. |
|
Employment rate of the disabled (%) |
Applies to regular and non-regular employees. |
Calculated using the same method used by the Ministry of Health, Labour and Welfare based on the Act to Facilitate the Employment of Persons with Disabilities, using March 1 as the reference date. |
| End of 2017 | End of 2018 | End of 2019 | End of 2020 | End of 2021 | End of 2022 | End of 2023 | |
|---|---|---|---|---|---|---|---|
| Female managers (person) | 32 | 36 | 79 | 113 | 130 | 141 | 148☑ |
| Percentage of female managers (%) | 9.9 | 11.5 | 21.1 | 27.5 | 29.5 | 30.9 | 32.2☑ |
| Number of female employees who take childcare leave (persons) | 4 | 3 | 6 | 1 | 7 | 3 | 7 |
| Percentage of female employees who take childcare leave (%) | 100 | 100 | 100 | 100 | 100 | 100 | 100 |
| Number of male employees who take childcare leave (persons) | 2.3 | 19 | 12 | 11 | 22 | 17 | 12 |
| Percentage of male employees who take childcare leave (%) | 43.8 | 90.5 | 85.7 | 78.6 | 110.0 | 100.0 | 108.3 |
| Employment rate of the disabled (%) | 2.3 | 2.3 | 2.1 | 2.4 | 2.2 | 2.3 | 2.5☑ |
2-3 Human Resources Development
Scope of coverage: Non-consolidated data
Reference date: Final day of calculation period (March 31) unless otherwise noted.
Total employee training hours (hours) / Average training hours per employee (hours)
| FY 2017 | FY 2018 | FY 2019 | FY 2020 | FY 2021 | FY 2022 | FY 2023 | |
|---|---|---|---|---|---|---|---|
| Total employee training hours (hours) | 18,093 | 19,118 | 19,937 | 19,809 | 20,175 | 20,073*11 | 20,598 |
| Average training hours per employee (hours) | 31.2 | 31.9 | 32.6 | 30.3 | 29.8 | 24.0 | 24.7 |
-
*11Some language support and qualification acquisition support programs that had been counted as training hours until fiscal 2021 have been excluded from calculation because they were changed to be covered under the cafeteria plan (self-development) from fiscal 2022.
Number of trainees sent overseas (persons)
| FY 2017 | FY 2018 | FY 2019 | FY 2020 | FY 2021 | FY 2022 | FY 2023 | |
|---|---|---|---|---|---|---|---|
| Number of employees sent overseas | 8 | 8 | 9 | 3 | 6 | 6 | 7 |
Number of employees who used the career track shift system (persons)
| Apr. 2018 | Apr. 2019 | Apr. 2020 | Apr. 2021 | Apr. 2022 | Apr. 2023 | Apr. 2024 | |
|---|---|---|---|---|---|---|---|
| Number of users | 1 | 0 | 2 | 6 | 0 | 2 | 0 |
Number of employees converted from contractors to full-time employees under the Full-time employee challenge system (persons)
| Apr. 2018 | Apr. 2019 | Apr. 2020 | Apr. 2021 | Apr. 2022 | Apr. 2023 | Apr. 2024 | |
|---|---|---|---|---|---|---|---|
| Number of users | 3 | 1 | 0 | 3 | 1 | 1 | 2 |
2-4 Health and Productivity Management
Scope of coverage: Non-consolidated data
Reference date: Final day of calculation period (March 31)
|
Indicator |
Calculation applicability |
Calculation method |
|---|---|---|
|
Rate of taking annual paid leave |
Applies to regular and non-regular employees employed from the first date of calculation through to the final date of calculation. (Applies to seconded employees, but does not apply to officers, those on long-term leave and those on incoming assignment). |
Leave acquisition rate = Number of days of paid leave taken by workers during the calculation period divided by the number of days of paid leave granted to workers during the calculation period, multiplied by 100. |
| FY 2017 | FY 2018 | FY 2019 | FY 2020 | FY 2021 | FY 2022 | FY 2023 | |
|---|---|---|---|---|---|---|---|
| Rate of taking annual paid leave (%) | 68.0 | 68.4 | 66.3*12 | 72.0 | 82.3 | 93.5 | 93.3☑ |
| Rate of employees receiving regular medical check-ups (%)*13 | 97.5 | 98.4 | 98.4 | 100 | 100 | 100 | 100 |
-
*12Due to restrictions on the number of employees coming to work in conjunction with the spread of COVID-19, actual data on paid leave for eight Fuyo General Lease (USA) Inc. employees is not included.
-
*13Regularly provided medical check-ups are categorized into general medical examinations for employees of less than 35 years of age and comprehensive medical examinations for employees of 35 years of age or above.
2-5 Labor Practices / Health and Safety
Scope of coverage: Non-consolidated data
Reference date: Final day of calculation period (March 31)
| FY 2017 | FY 2018 | FY 2019 | FY 2020 | FY 2021 | FY 2022 | FY 2023 | |
|---|---|---|---|---|---|---|---|
| Number of industrial accidents (number of cases)*14 | 1 | 2 | 4 | 2 | 3 | 2 | 6 |
-
*14Accidental injuries due to falling in the street while commuting, all of which are minor injuries.